Tree height explains mortality risk during an intense drought
Stovall, Atticus EL, Herman Shugart, and Xi Yang
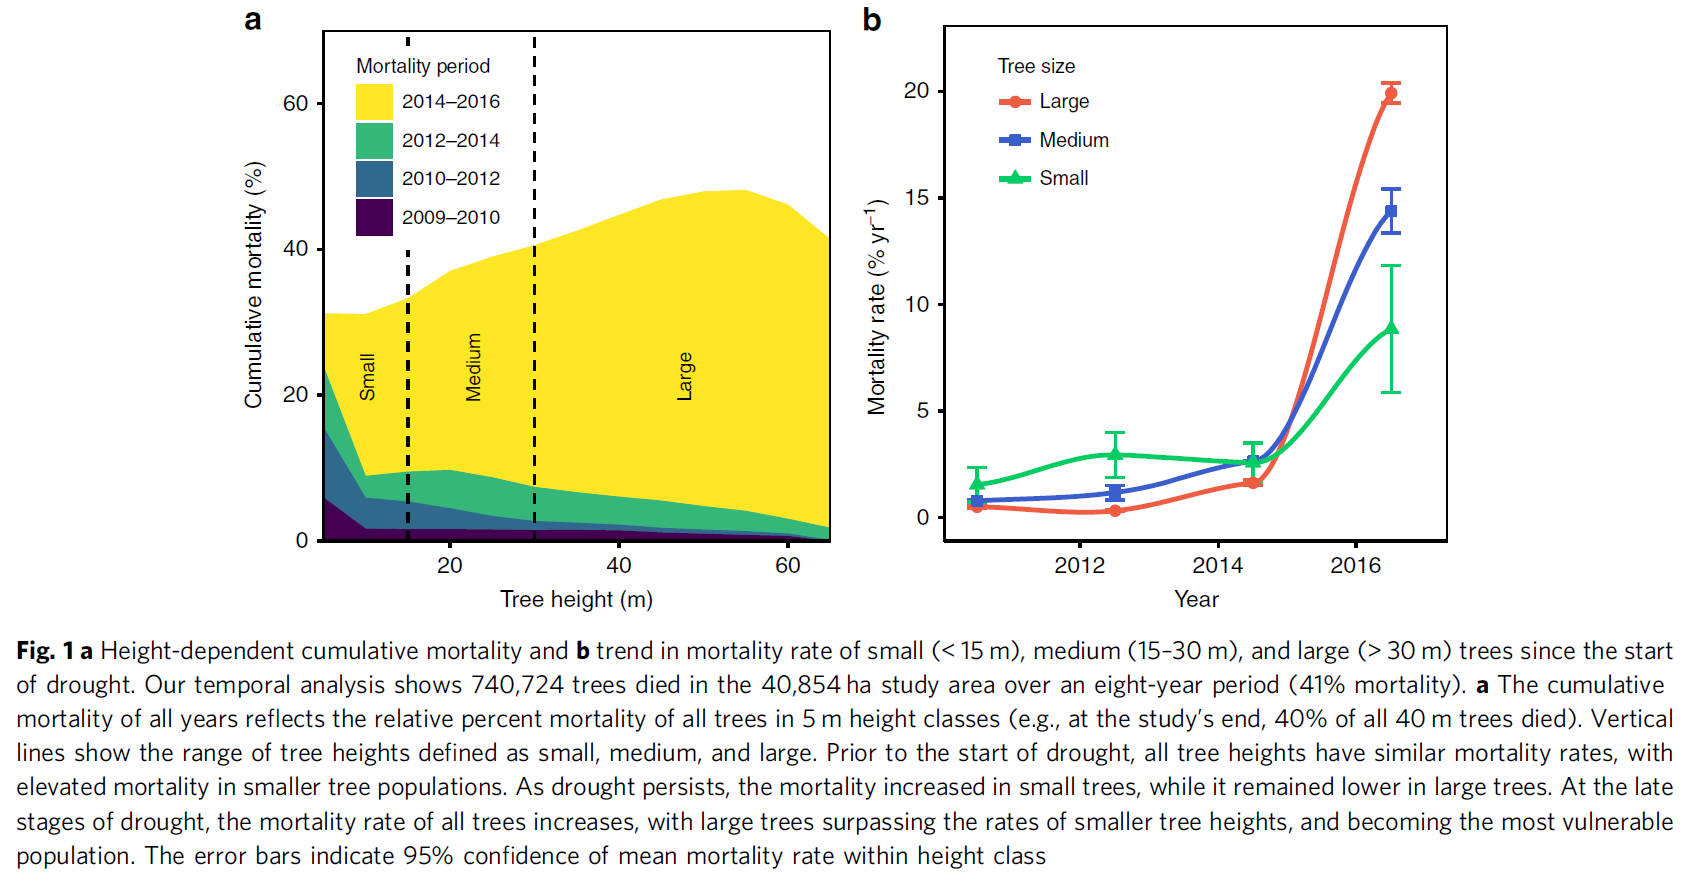
The temporal trend of tree mortality clearly shows height-dependent trajectories (Fig. 1). We initially tested the relative percent mortality at 5 m tree height classes from 2009 to 2016 to determine the presence of a height-dependent relationship over the drought period (Fig. 1a). We simplify the analysis into small (< 15 m), medium (15–30 m), and large (> 30 m) height classes for interpretation of the time series (Fig. 1b). In total, we identified 305,600 small trees, 855,730 medium trees, and 647,004 large trees. From 2009 to 2010, mortality was 1.56, 0.80, and 0.58% yr−1 for small, medium, and large trees, respectively. From 2010 to 2014, mortality rate rose across all tree heights and by 2014 cumulative mortality was 14.15%, 9.24%, and 5.09% for small, medium, and large trees, respectively. In 2016, large-tree mortality rate surged from the background rate of ~1–19.90% yr−1, while small and medium height trees died at a rate of 8.85 and 14.38% yr−1. By 2016, cumulative mortality was highest in large trees (45%), followed by medium (38%) and small (32%) trees. Overall, we estimate that 740,724 or 41% of the measured trees died from 2009 to 2016.